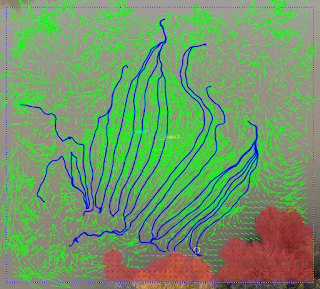
What´s beneath the following flow pattern ? Drone zenithal view subsequently vectorized with LSPIV. You´ve got it; just this groyne when submerged flow begins !
A rather complex process, which can lead to spectacular images of mixing eddies. Practical questions like: what´s the mixing length, the influence of each stream speed and width, and how do they change along the interface, can be derived for simple cases with math models.
A good example of sun glitter while the drone raises and films oriented towards the sun, however it can be helpful to determine a correlation between surface reflectance and roughness, and related flow speed.
Drones make easier to recognize surface speed patterns and debris storage areas in order to clean up plastic litter , as this image of Alcala de Ebro groynes shows. See more at The Ocean Clean Up project and https://doi.org/10.3390/rs11172045
This is a particular village 30 Kms upstream Saragosse along the Ebro river, Google-Map , where we can observe a riverine island with its typical confluence pattern, and our computer LSPIV video processing:
Shallow flows with relatively transparent water, captured by 4K camera drones and filtered by computer, can help to define the bathymetry without more expensive data acquisition. See this example nearby "Sotos del Ebro, Alfaro".
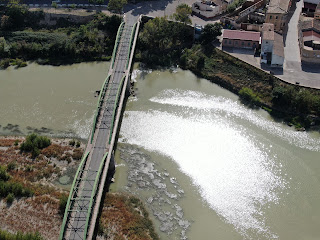
Tests at Castejon de Ebro: Checking heights for look angles, fields of view and resulting flow resolution around Castejon railway bridge, during the dry season . This is a key reach for monitoring the Ebro river during flood periods.